
To explain the Dynamo code, I am using Revit Advance Sample model as test case.

The first part of the Dynamo code gets the levels that the user wants to perform daylighting analysis. The code gets all elements at these levels and removes everything from the list other than floors. The node Element.Geometry visualizes the selected floors in Dynamo canvas.
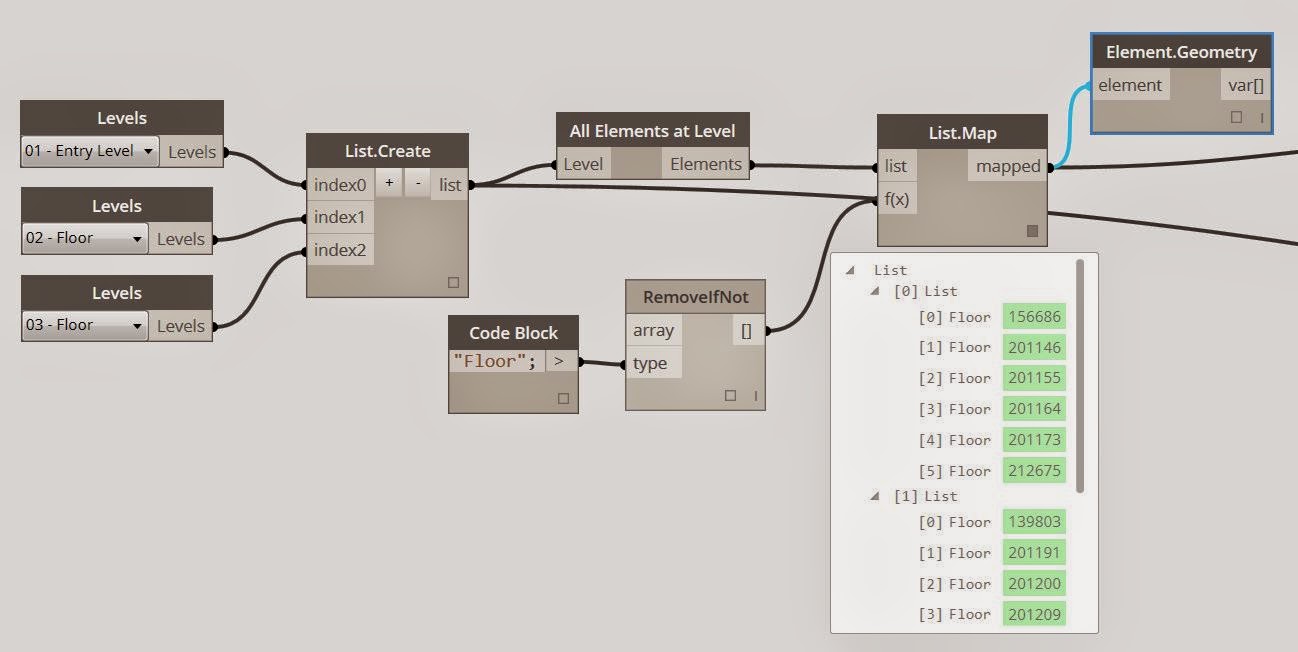
As you can see in this case, since shading devices in this model are created using Floor family and assigned to the same levels as building floors, they are included in the list as well (see the image below). To remove the shadings you can simply create a new level at the same height and assign shading devices to those levels.

The second part of the code tries to get the Bottom Left, Bottom Right, and Top Left points of the floors using floor bounding box and a simple code in a code block. For the Z value of the points, the floors' Z value is added to "Work Level Height" to get the daylighting results for each floor at desk level. These points are used as the input parameters for the CloudDaylightingJob.ByViewNameDivisionsGridBoundary node.

The next step is to create Rendering Environment using Sky Model, Building Location, and Date/Time. In order to create Sky Model, you can find valid values for direct normal irradiance (DNI), diffuse horizontal irradiance (DHI), and global horizontal irradiance (GHI) values from the weather files that are built-into Autodesk Green Building Studio website. See this BPA Help page for detailed information.The values of DHI, GHI, and DNI are collected from weather data file for 9 am and 3 pm. If you have set the building location for the model in Energy Settings form Revit Analyze tab, you can use Document.Location node to get Longitude and Latitude. Using DateTime node you can set the exact time that you want to perform daylighting analysis for. In this case the Rendering Environment node creates two rendering environment based on the SkyModel information provided for 9 am and 3 pm on September 21st.

Note: Dynamo has two very similar node DateTime.ByDateAndTime from Dynamo Core category and DateTime.ByDateInformation from Analyze category. For daylighting analysis you need to use the one from analyze category.

The minimum value for x and y divisions is 150. The x and y divisions are used to create a grid for daylighting sensors. In this case we have used {3D} view for creating render job as well as export cloud render data. Since Export Cloud Render Data interacts with Revit, it has to be in between transaction nodes. DoCloudRender node submits the daylighting job to Autodesk’s Cloud Rendering Service. you can see the illuminance rendering jobs and their progress on render gallery by going to View tab in Revit > Render Gallery. In this example two render jobs will be submitted to Cloud Rendering Service for 9 am and 3 pm.

In the Daylighting workflow, it is tried to create an option for customized lighting analysis. There are many users that have used Lighting Analysis for Revit (LAR). The daylighting workflow on Dynamo is created for those who want to perform lighting analysis in Revit with custom settings. in the last part of the workflow the rendering results are parsed using a Python Script based on USGBC LEED requirement for Daylighting.

The Python Script gets the Minimum and Maximum accepted values as inputs along with simulation results and list of levels to calculate the percentage of the area within, above, and below the threshold. The area percentages are reported a the output of the Python Script node. Below is the Python Script that is create to calculate these values.
1:  import clr
2:  import math
3:  clr.AddReference('ProtoGeometry')
4:  from Autodesk.DesignScript.Geometry import *
5:  # Import RevitAPI
6:  clr.AddReference('RevitAPI')
7:  import Autodesk
8:  # Import DocumentManager and TransactionManager
9:  clr.AddReference('RevitServices')
10:  import RevitServices
11:  from RevitServices.Persistence import DocumentManager
12:  from RevitServices.Transactions import TransactionManager
13:  # Import ToDSType(bool) extension method
14:  clr.AddReference('RevitNodes')
15:  import Revit
16:  clr.ImportExtensions(Revit.Elements)
17:  #=================================================
18:  doc = DocumentManager.Instance.CurrentDBDocument
19:  uiapp = DocumentManager.Instance.CurrentUIApplication
20:  app = uiapp.Application
21:  levels = IN[0]
22:  illumVal = IN[1]
23:  points = IN[2]
24:  minAcceptedIllum = IN[3]
25:  maxAcceptedIllum = IN[4]
26:  Autodesk.Revit.DB.BuiltInCategory
27:  #Collects curtain walls
28:  rooms = Autodesk.Revit.DB.FilteredElementCollector(doc)
29:  rooms.OfCategory(Autodesk.Revit.DB.BuiltInCategory.OST_Rooms)
30:  #finds the rooms that are at the mentioned level and puts them in a list
31:  rmLevelLst = []
32:  for i in range (0, len(levels)):
33:       roomLev = []
34:       for rm in rooms:
35:            if rm.Level.Name == levels[i].Name:
36:                 occ = rm.get_Parameter("Occupancy")
37:                 if occ.AsString() != "0":
38:                      roomLev.append(rm)
39:       rmLevelLst.append(roomLev)
40:  #adds points that are in the rooms into in range list
41:  #and total points list to calculate the percentage
42:  Result =[]
43:  for i in range (0, len(points)):
44:       resList = []
45:       for j in range (0, len(points[i])):
46:            pntInRoomLst = []
47:            pntInRangeLst = []
48:            pntBelowRange = []
49:            pntAboveRange = []
50:            for k in range (0, len(points[i][j])):
51:                 for occRoom in rmLevelLst[j]:
52:                      xyz = Autodesk.Revit.DB.XYZ(points[i][j][k].X, points[i][j][k].Y, points[i][j][k].Z)
53:                      if occRoom.IsPointInRoom(xyz):
54:                           pntInRoomLst.append(xyz)
55:                           if illumVal[i][j][k] < maxAcceptedIllum and illumVal[i][j][k] > minAcceptedIllum :
56:                                pntInRangeLst.append(points[i][j][k])
57:                           if illumVal[i][j][k] > maxAcceptedIllum:
58:                                pntAboveRange.append(points[i][j][k])
59:                           if illumVal[i][j][k] < minAcceptedIllum:
60:                                pntBelowRange.append(points[i][j][k])
61:            if len(pntInRoomLst)!=0:
62:                 percentInRange = len(pntInRangeLst)/float(len(pntInRoomLst))
63:                 percentAboveRange = len(pntAboveRange)/float(len(pntInRoomLst))
64:                 percentBelowRange = len(pntBelowRange)/float(len(pntInRoomLst))
65:            else:
66:                 percentInRange = percentAboveRange = percentBelowRange = 0
67:            if percentInRange == 0 and percentAboveRange == 0 and percentBelowRange == 0:
68:                 resList.append ("There is no room in this level")
69:            else:
70:                 resList.append(str(round(percentInRange*100))+"%"+ " in the range - " + str(round(percentAboveRange*100))+"%"+ " aAbove the range - " + str(round(percentBelowRange*100))+"%"+ " below the range" )
71:       Result.append(resList)
72:  OUT = Result
Hope this workflow is useful for your work process.